
Performance Profiling#
Code profiling is the process of measuring the amount of time a program spends on each function or line of code. This is used to identify performance bottlenecks and optimise code for better performance.
You can profile any Python code with the built-in cProfile module:
python -m cProfile -o profile.pstats your_script.py
In CapyMOA you can do this automatically by adding the --profile flag to invoke:
invoke test.pytest --profile profile.pstats -- tests/test_classifiers.py -k ShrubsClassifier
Now that we have a profile file, we can analyse it.
SnakeViz#
One of the best analysis tools for this is SnakeViz:
pip install snakeviz
snakeviz profile.pstats
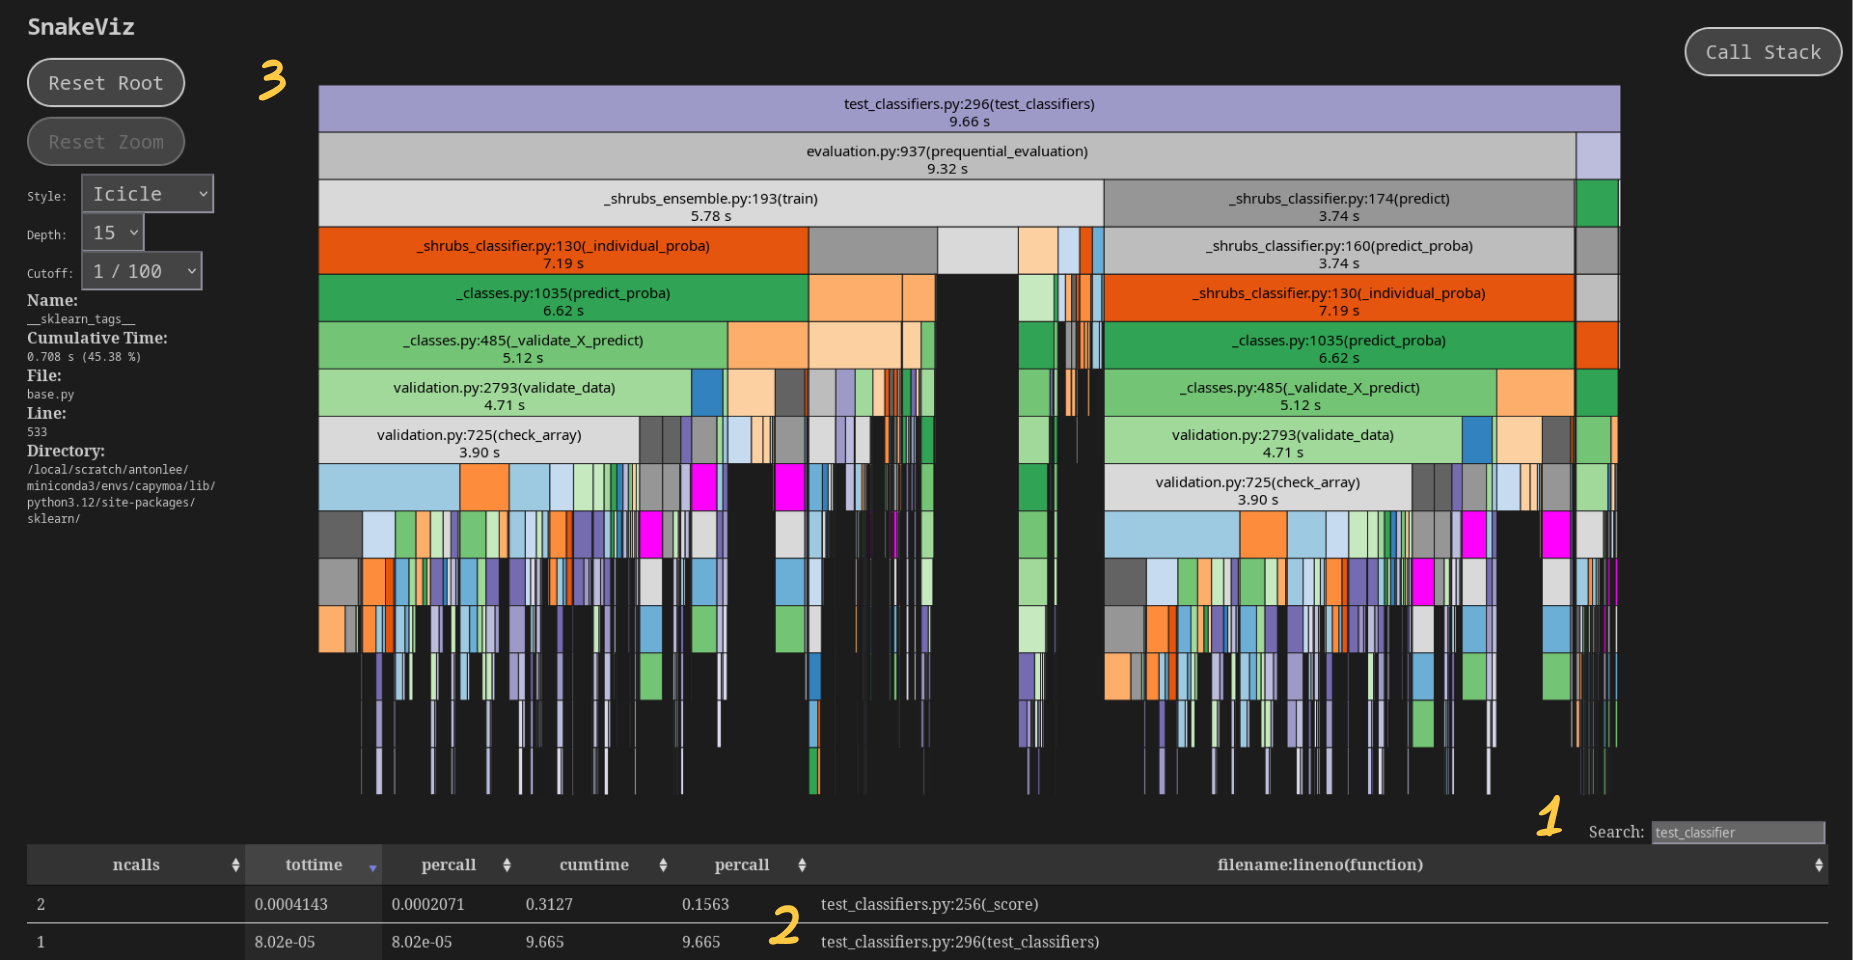
You can search for the specific function you want to profile.
From the table you can click on the function to see a breakdown of the time spent in that function and its children. You can hover over the header to get a tooltip with more information about the columns.
This is flame graph view which shows the time spent in each function and its children. The width of each box represents the time spent in that function. It is sometimes necessary to fiddle with the depth and cutoff to avoid lag when rendering the graph.
gprof2dot#
Another tool for visualising profiles is gprof2dot:
pip install gprof2dot
gprof2dot -f pstats profile.pstats \
    --root=test_classifiers:296:test_classifiers \
    --node-thres=5 | dot -Tpng -o profile.png
--rootspecifies the function to start the graph from. This is useful for focusing on a specific part of the code. It is of the formmodule:function:lineand can be found in the SnakeViz table.--node-thresspecifies the minimum percentage of time a function must take to be included in the graph. This is useful for filtering out noise and focusing on the most important functions.
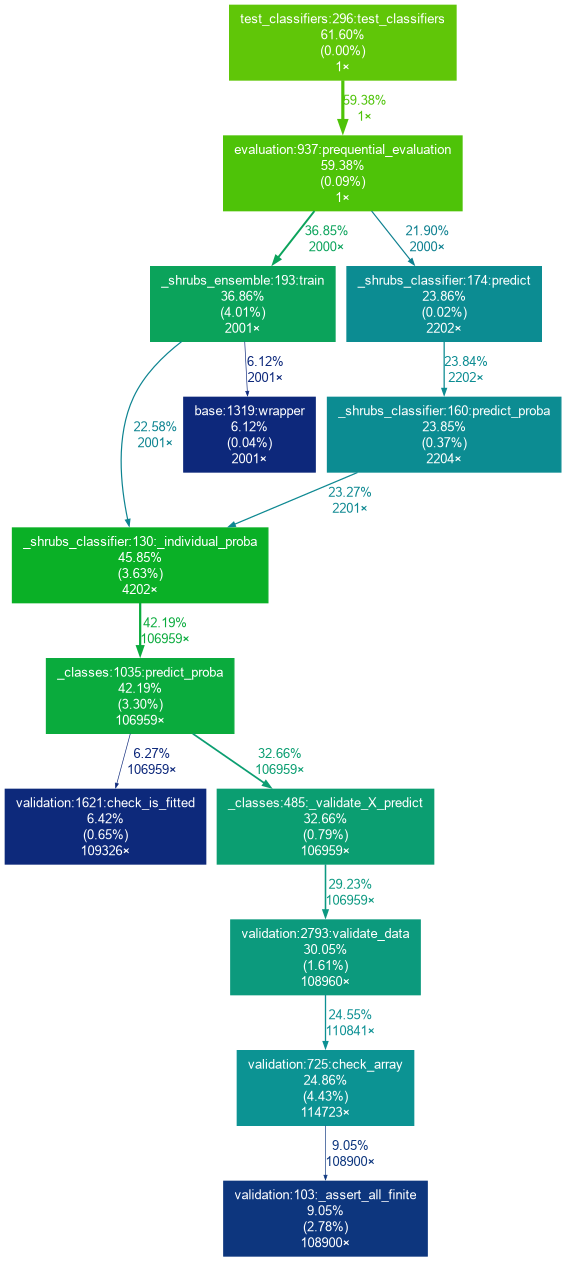
Each node in the visualization follows this structure:
+------------------------------+
|        function name         |
| total time % ( self time % ) |
|         total calls          |
+------------------------------+
Total Time: The cumulative percentage of execution time spent within this function and all subsequent functions it called.
Self Time: The percentage of execution time spent exclusively on this function’s own logic, excluding any time spent in child functions.
Total Calls: The aggregate count of how many times this specific function was executed during the profile.
Conclusion#
From this profiling we can see that the ShrubsClassifier is slowed down by scikit-learn’s
validation checks which are not necessary in our use case. For DecisionTreeClassifier, we can disable them with .predict_proba(X.astype(np.float32, copy=False), check_input=False), which results in a significant speedup (8s -> 4s).