Clustering tutorial#
This tutorial demonstrates the experimental clustering API for CapyMOA. Clustering data streams refers to grouping data points into clusters as the data continuously flows in, which normally includes two phases:
Online step:
Micro-cluster formation: Incoming data points are incrementally processed and assigned to micro-clusters. Micro-clusters are small, temporary clusters that capture local density information and are typically represented by statistical summaries like the centroid, weight, and radius.
Micro-cluster maintenance: The micro-clusters are periodically updated as new data arrives. This includes adjusting the micro-cluster centroids and merging or splitting clusters based on defined thresholds.
Offline step: Periodically or upon request, micro-clusters are aggregated into macro-clusters (or simply clusters) to provide a higher-level view of the data.
This is an experimental API might change significantly in the near future.
More information about CapyMOA can be found at https://www.capymoa.org.
last update on 28/11/2025
Creating and using a clusterer#
Example using
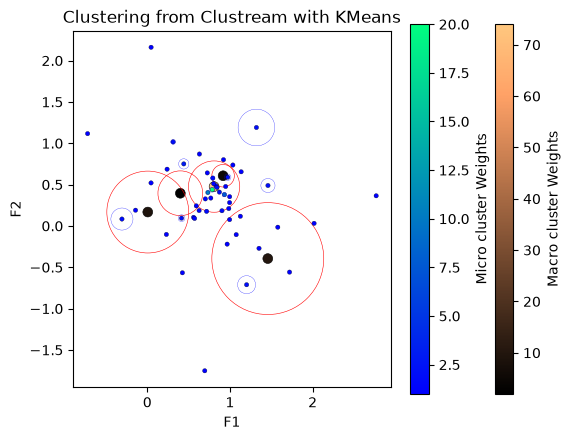
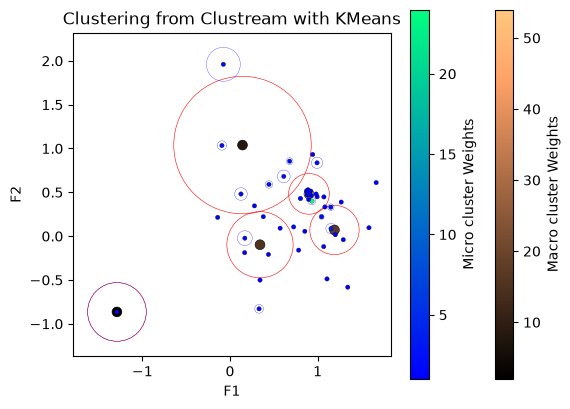
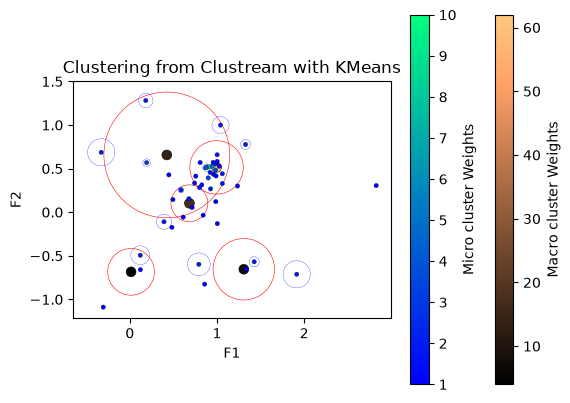
CluStreamandkMeansfor the offline step.There is no evaluation included in the example below, just updating and plotting of the cluster.
The data is generated using
RandomRBFGeneratorDrift.We use a visualisation function to plot the clustering state.
from capymoa.cluster import Clustream_with_kmeans as WithKmeans
from capymoa.evaluation.visualization import plot_clustering_state
from capymoa.stream.generator import RandomRBFGeneratorDrift

stream = RandomRBFGeneratorDrift(
    number_of_attributes=2,
    number_of_centroids=5,
    number_of_drifting_centroids=1,
    magnitude_of_change=0.001,
)
clustream = WithKmeans(
    schema=stream.get_schema(),
    time_window=100,
    max_num_kernels=50,
    kernel_radi_factor=2,
    k_option=5,
)
instancesSeen = 0
updateInterval = 100
instances_limit = 300
while stream.has_more_instances() and instancesSeen < instances_limit:
    instance = stream.next_instance()
    clustream.train(instance)
    instancesSeen += 1
    if instancesSeen % updateInterval == 0:
        print(f"Processed {instancesSeen} instances.")
        plot_clustering_state(clustream)
        # by default, plot_clustering_state only shows the image and does not save it
Processed 100 instances.
Processed 200 instances.
Processed 300 instances.
Using the ClusteringEvaluator#
from capymoa.evaluation import ClusteringEvaluator

stream = RandomRBFGeneratorDrift(
    number_of_attributes=2,
    number_of_centroids=10,
    number_of_drifting_centroids=1,
    magnitude_of_change=0.001,
)
clustream = WithKmeans(
    schema=stream.get_schema(),
    time_window=1000,
    max_num_kernels=25,
    kernel_radi_factor=2,
    k_option=5,
)
evaluator = ClusteringEvaluator(update_interval=100)
Plot the clustering state on demand#
instances_limit = 1000
while stream.has_more_instances() and evaluator.get_instances_seen() < instances_limit:
    instance = stream.next_instance()
    clustream.train(instance)
    evaluator.update(clustream)
    instancesSeen = evaluator.get_instances_seen()
    # purposefully arbitrary number
    if instancesSeen == 157:
        # can also skip show and only save
        print(
            f"Processed {instancesSeen} instances. Saving the figure without showing it."
        )
        plot_clustering_state(
            clustream, show_fig=False, save_fig=True, figure_name="save_fig_dont_show"
        )
Processed 157 instances. Saving the figure without showing it.
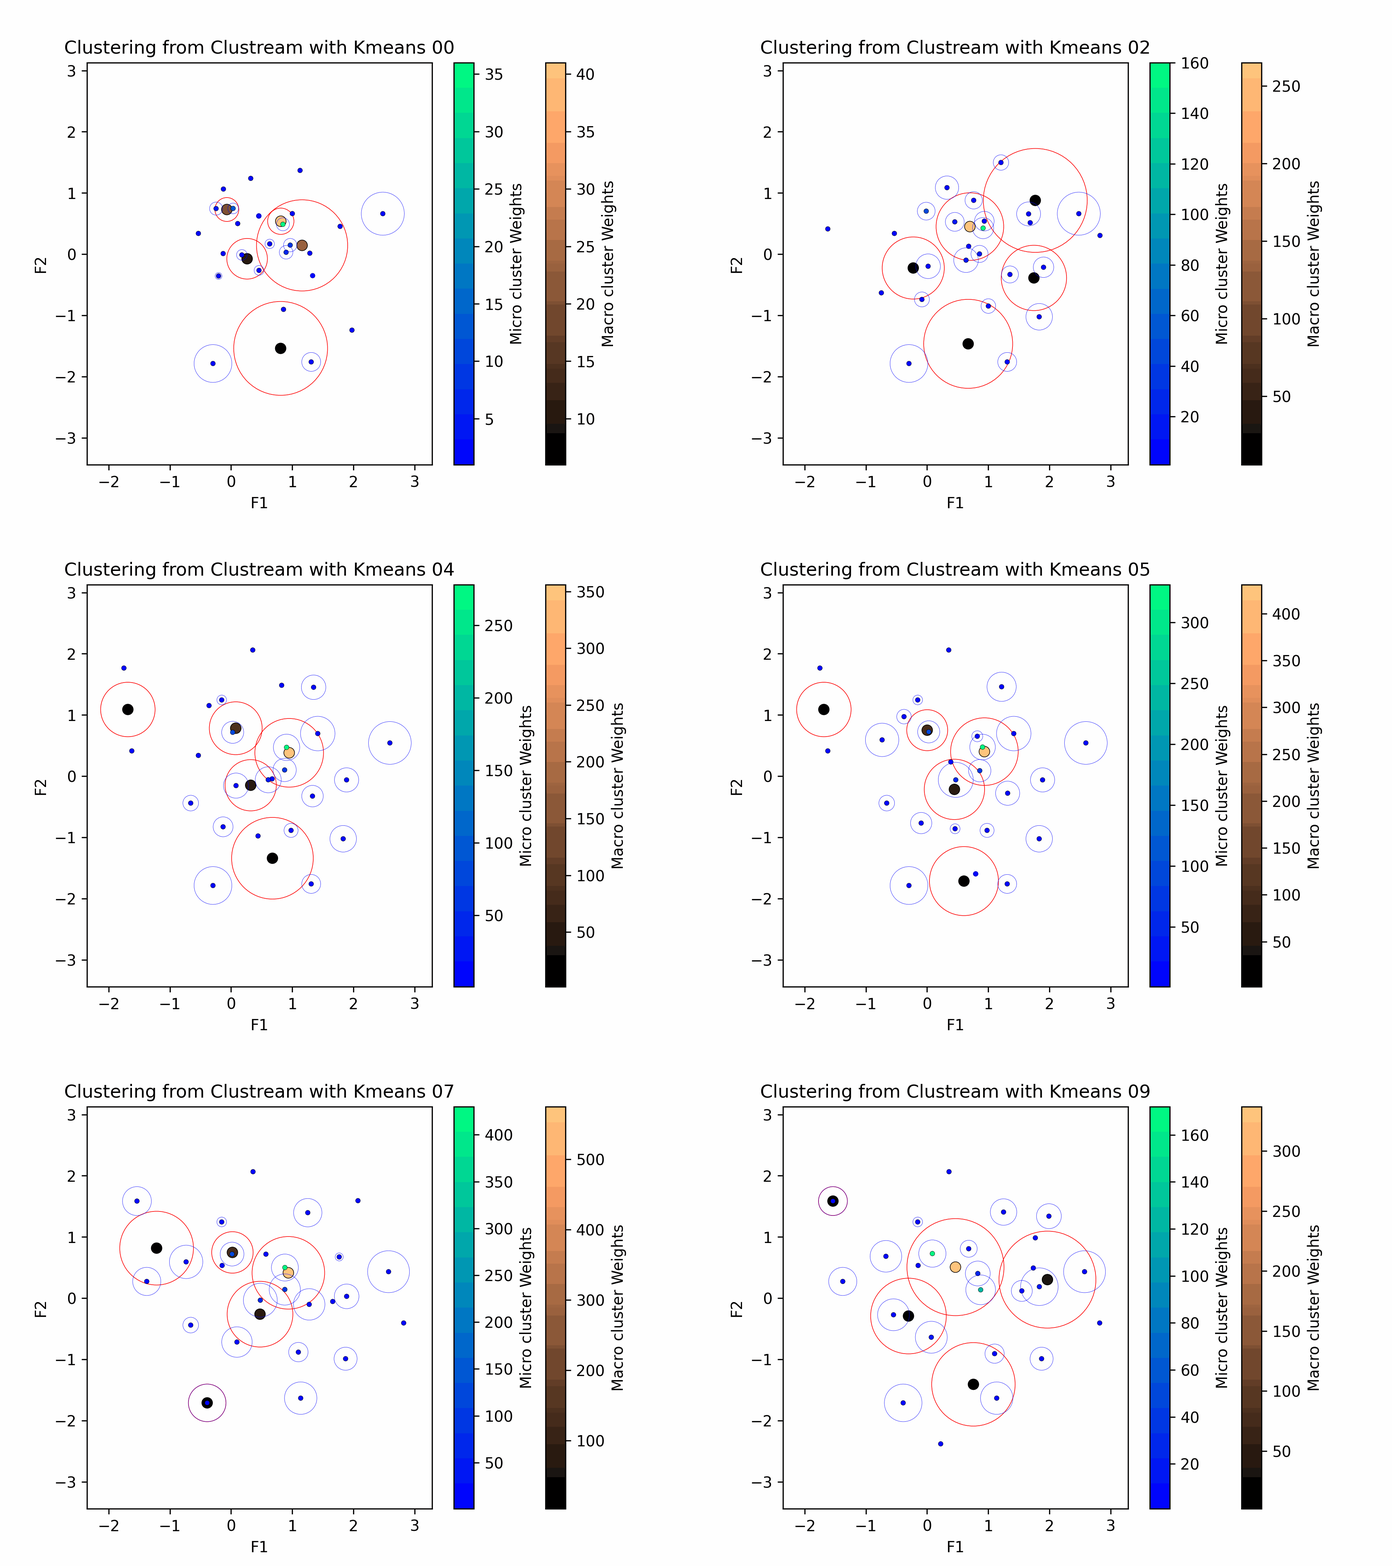
Plot the clustering evolution (gif)#
Passing
clean_up=Falseto theplot_clustering_evolutionfunction will keep the intermediate figures used to create the gif.You need the
ClusteringEvaluatorto generate the gif.Default filename will be
<clusterer_name>_clustering_evolution.gif
from capymoa.evaluation.visualization import plot_clustering_evolution

plot_clustering_evolution(evaluator, clean_up=True, frame_duration=1000)
from IPython.display import Image

# Display the GIF
Image(filename="./Clustream_with_Kmeans_clustering_evolution.gif")
Using DenStream with DBSCAN#
from capymoa.cluster import Denstream_with_dbscan as Denstream

denstream = Denstream(
    schema=stream.get_schema(),
    horizon=1000,
    epsilon=0.04,
    beta=0.2,
    mu=1.2,
    init_points=100,
    offline_option=3,
    lambda_option=0.25,
    speed=200,
)
stream = RandomRBFGeneratorDrift(
    number_of_attributes=2,
    number_of_centroids=10,
    number_of_drifting_centroids=1,
    magnitude_of_change=0.001,
)
evaluator = ClusteringEvaluator(update_interval=100)
instances_limit = 1000
while stream.has_more_instances() and evaluator.get_instances_seen() < instances_limit:
    instance = stream.next_instance()
    denstream.train(instance)
    evaluator.update(denstream)
    instancesSeen = evaluator.get_instances_seen()
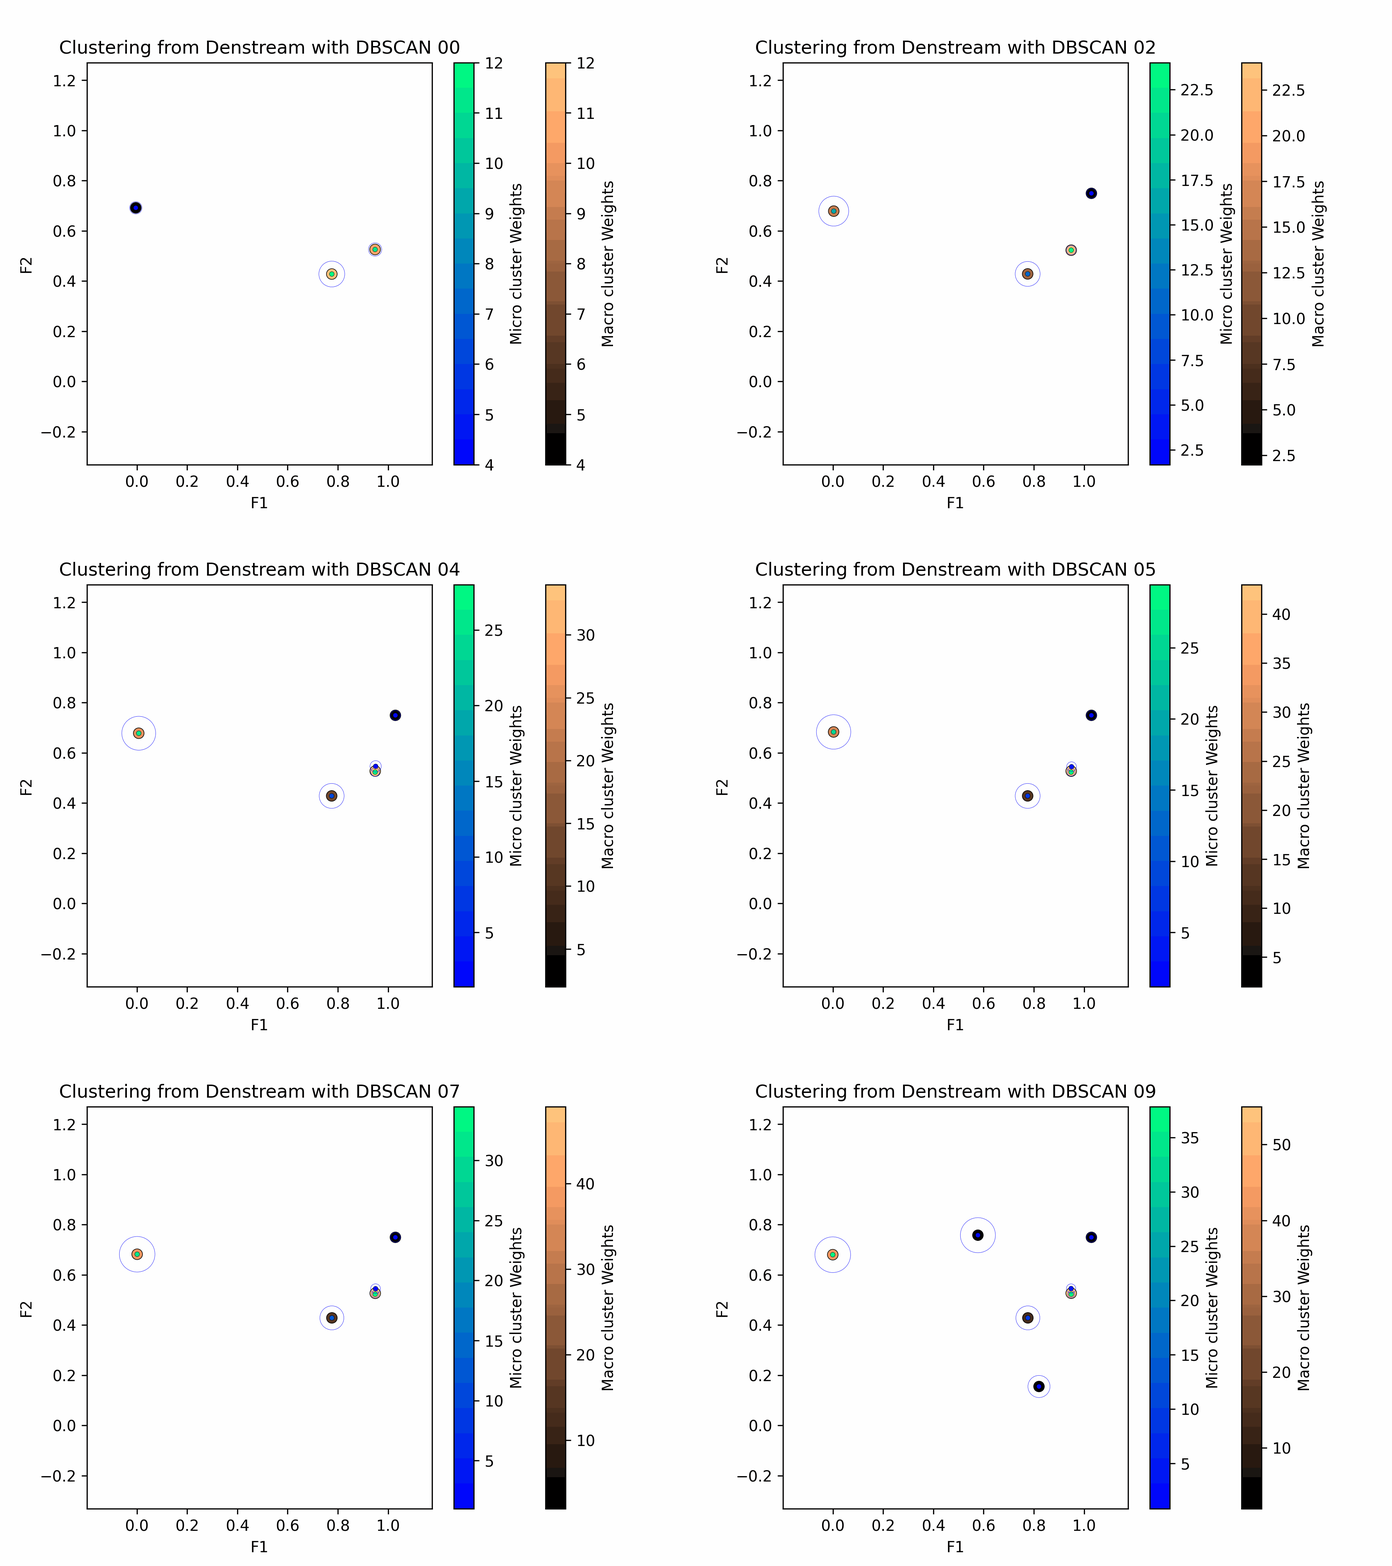
You can choose the name of the gif file using the
filenameoption.
# This will save the clusterer as output
plot_clustering_evolution(
    evaluator, clean_up=True, filename="DeNSTReaM_clustering_custom_name.gif"
)
# Display the GIF
Image(filename="./DeNSTReaM_clustering_custom_name.gif")
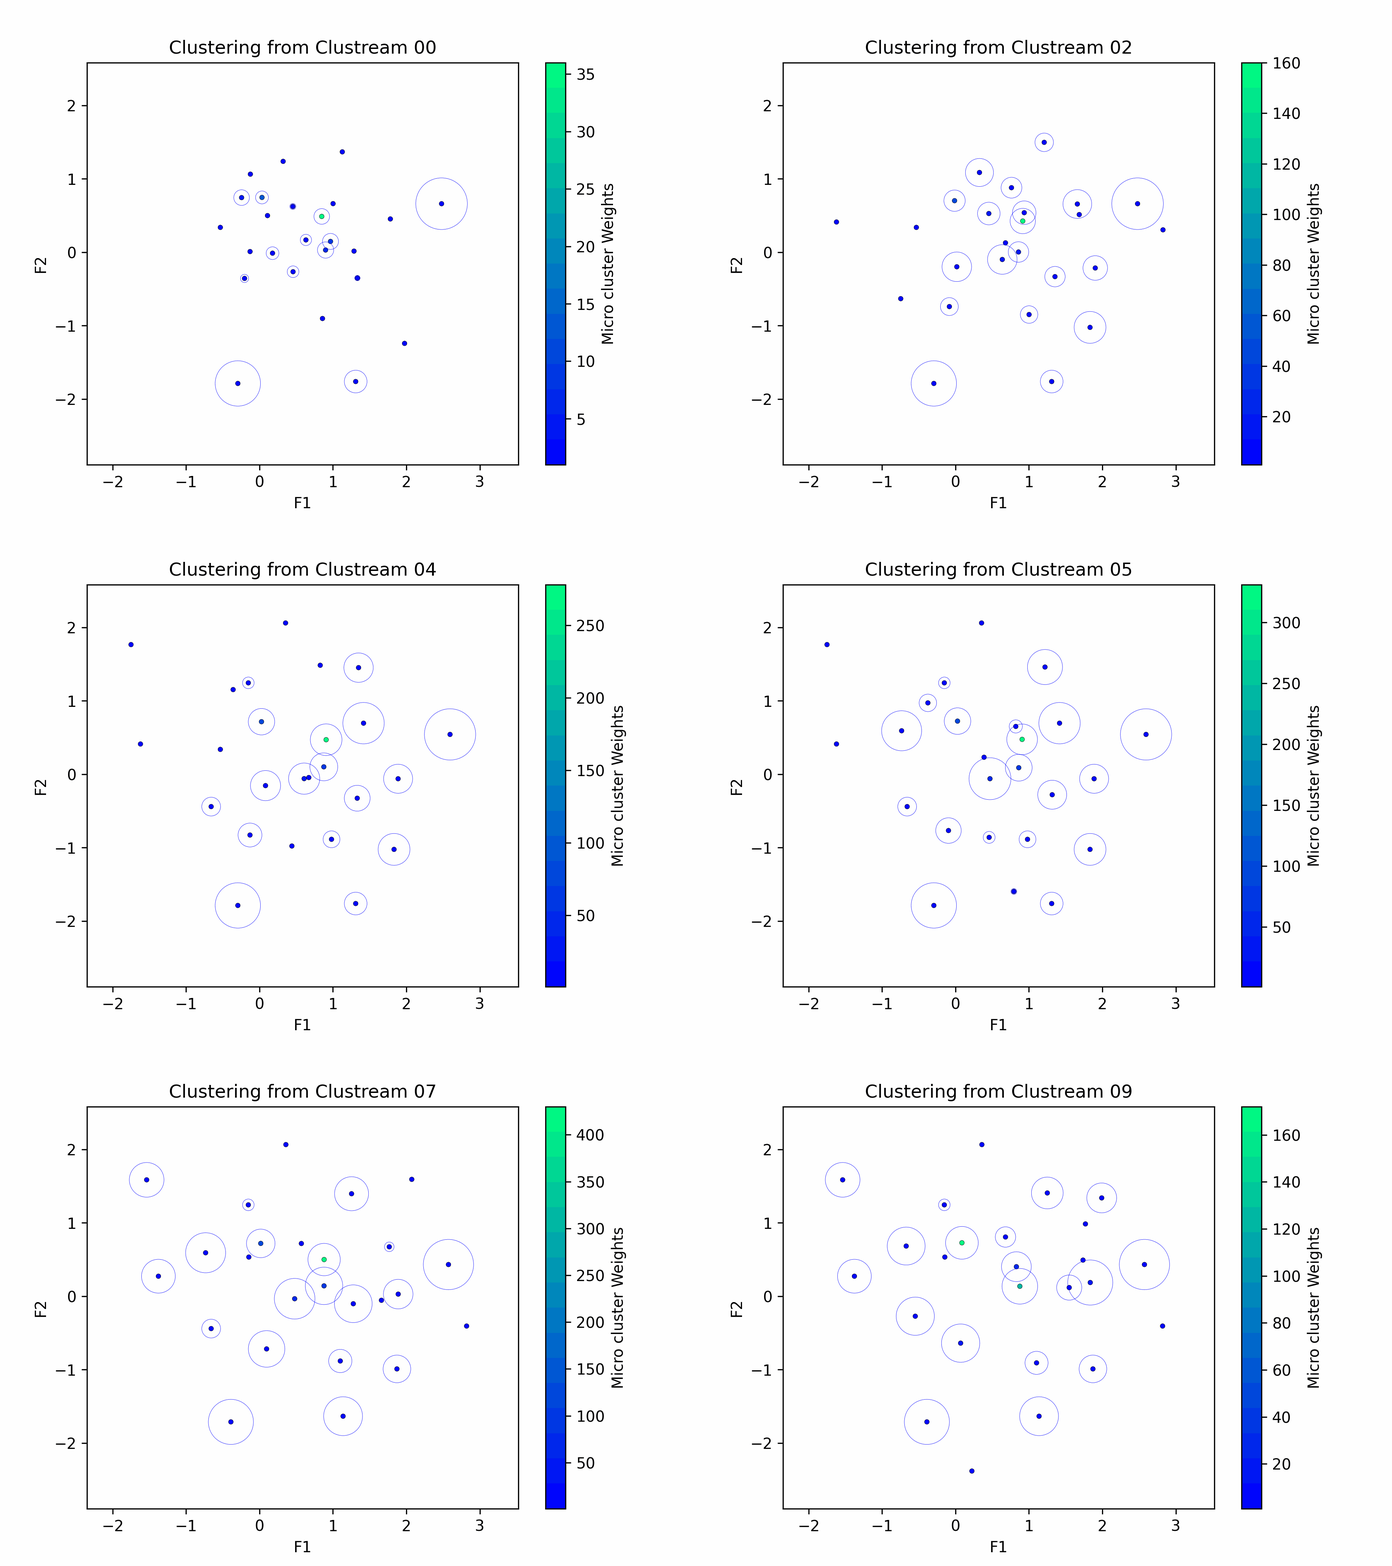
Using Clustream without macro-clustering#
from capymoa.cluster import Clustream as ClustreamMicro

clustream_micro = ClustreamMicro(
    schema=stream.get_schema(),
    kernel_radi_factor=2,
    time_window=1000,
    max_num_kernels=25,
)
stream = RandomRBFGeneratorDrift(
    number_of_attributes=2,
    number_of_centroids=10,
    number_of_drifting_centroids=1,
    magnitude_of_change=0.001,
)
evaluator = ClusteringEvaluator(update_interval=100)
instances_limit = 1000
while stream.has_more_instances() and evaluator.get_instances_seen() < instances_limit:
    instance = stream.next_instance()
    clustream_micro.train(instance)
    evaluator.update(clustream_micro)
    instancesSeen = evaluator.get_instances_seen()
# This will save the clusterer as output
plot_clustering_evolution(evaluator, clean_up=True)
# Display the GIF
Image(filename="./Clustream_clustering_evolution.gif")
Using ClusTree#
from capymoa.cluster import ClusTree

clustree = ClusTree(
    schema=stream.get_schema(), horizon=500, max_height=7, breadth_first_strategy=True
)
stream = RandomRBFGeneratorDrift(
    number_of_attributes=2,
    number_of_centroids=10,
    number_of_drifting_centroids=1,
    magnitude_of_change=0.001,
)
evaluator = ClusteringEvaluator(update_interval=100)
instances_limit = 1000
while stream.has_more_instances() and evaluator.get_instances_seen() < instances_limit:
    instance = stream.next_instance()
    clustree.train(instance)
    evaluator.update(clustree)
    instancesSeen = evaluator.get_instances_seen()
# This will save the clusterer as output
plot_clustering_evolution(evaluator, clean_up=True)
# Display the GIF
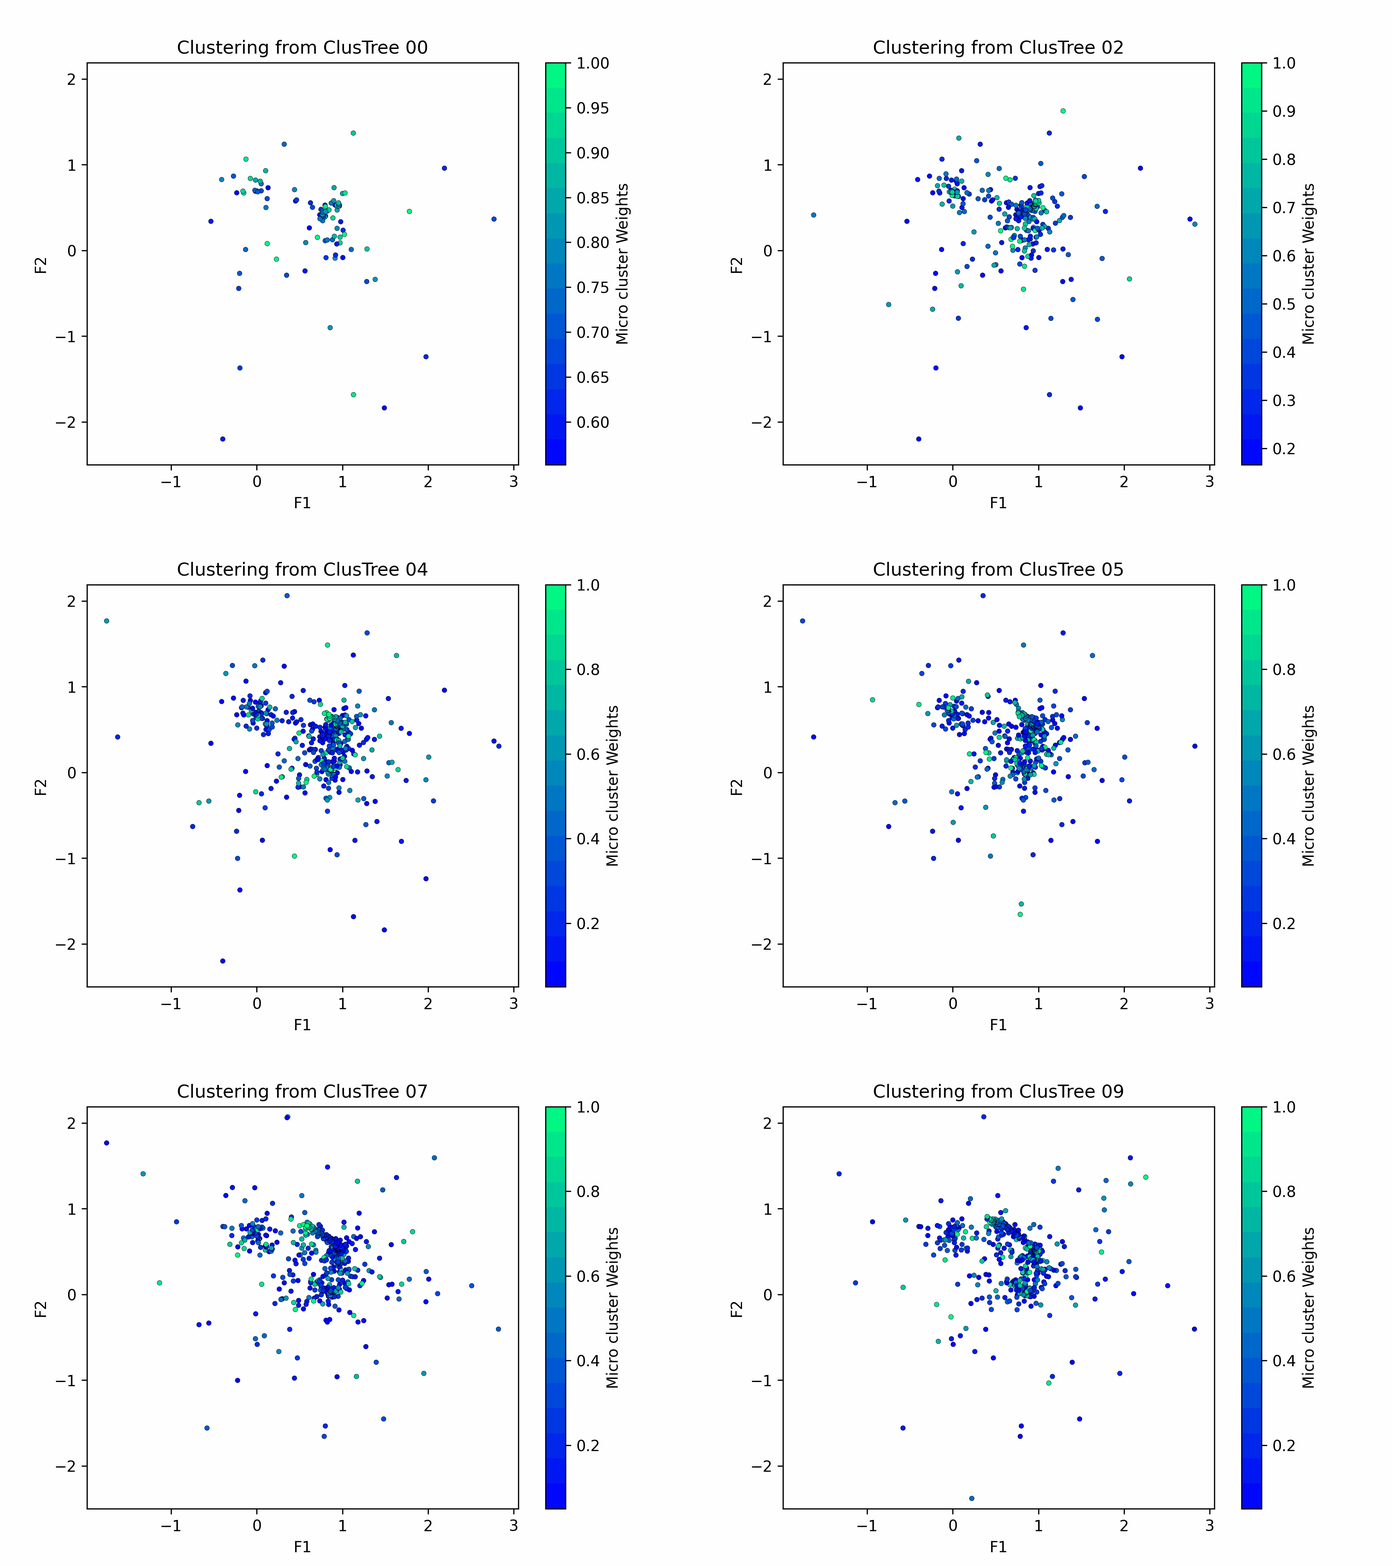
Image(filename="./ClusTree_clustering_evolution.gif")