Getting started with regression#
This notebook shows some basic usage of CapyMOA for streaming regression.
There are more detailed notebooks and documentation available; our goal here is just to present some high-level functions and demonstrate a subset of CapyMOA’s functionalities.
For simplicity, we simulate data streams in the following examples using datasets and employing synthetic generators. One could also read data directly from a CSV or ARFF (See stream_from_file function).
More information about CapyMOA can be found at https://www.capymoa.org
last update on 05/08/2026
Regression#
Regression algorithms have APIs very similar to classification algorithms. We can use the same high-level evaluation and visualisation functions for regression and classification, such as
prequential_evaluationandplot_windowed_results(see notebooks/classifier for an introduction to these functions).Similar to classification, we can also use MOA objects through a generic API.
from moa.classifiers.trees import FIMTDD

from capymoa.base import MOARegressor
from capymoa.datasets import Fried
from capymoa.evaluation import prequential_evaluation
from capymoa.evaluation.visualization import plot_windowed_results
from capymoa.regressor import KNNRegressor

fried_stream = (
    Fried()
)  # Downloads the Fried dataset into the data dir in case it is not there yet.
fimtdd = MOARegressor(schema=fried_stream.get_schema(), moa_learner=FIMTDD())
knnreg = KNNRegressor(schema=fried_stream.get_schema(), k=3, window_size=1000)

results_fimtdd = prequential_evaluation(
    stream=fried_stream, learner=fimtdd, window_size=5000
)
results_knnreg = prequential_evaluation(
    stream=fried_stream, learner=knnreg, window_size=5000
)

results_fimtdd.windowed.metrics_per_window()
# Note that the metric is different from the ylabel parameter, which just overrides the y-axis label.
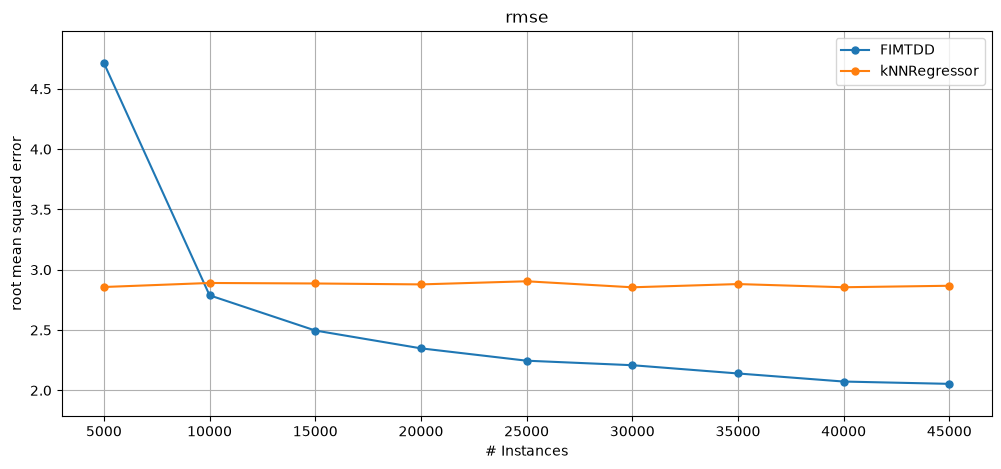
plot_windowed_results(
    results_fimtdd, results_knnreg, metric="rmse", ylabel="root mean squared error"
)